Seller Decision Toolkit — Priya Gupta
ZILLOW · CASE STUDY

Seller Decision Making Toolkit

Designed Market Insights and Demand Discovery tools to help sellers answer two key questions: "should I sell or wait?" and "how fast can I sell?" Increased iOS conversion rates by 14.8% and 26.9% respectively.

ROLESole Designer
TEAMSeller Tools and Experience
TIMELINE2025 – 2026
PLATFORMiOS, Android and Web
Timeline: Market Insights V1 Demand Discovery V1 Market Insights V2 Demand Discovery V2

The user problem

Decision paralysis from static valuation.
Potential sellers need to answer three core questions: Is now the right moment? How fast will my home sell? What will I net? Zestimate offered a static valuation number, but zero context on market timing.

The business problem

Top-of-funnel drop-off before agent conversion.
Homeowners who get stuck evaluating “Should I sell?” churn before connecting with an agent on Zillow.

Context

Zillow earns when a homeowner connects with an agent.
The Zestimate is Zillow’s most-used free seller tool. It tells homeowners what their home is worth, but not whether it’s the right time to sell.

An opportunity to translate Zillow data into intuitive and contextual information. A unified view where homeowners easily and quickly understood their selling position.

What we built

The shipped solutions

I shipped two tools. Market Insights answers whether this is the right moment; Demand Discovery answers what a given price would mean for time-to-sell and net outcome.

Tool 1

Market Insights V2

Result
+14.8% agent connections, iOS
Market Insights V2. Statistically significant lift in seller-to-agent conversions.
engagement vs. V1 25%returned within a week
1
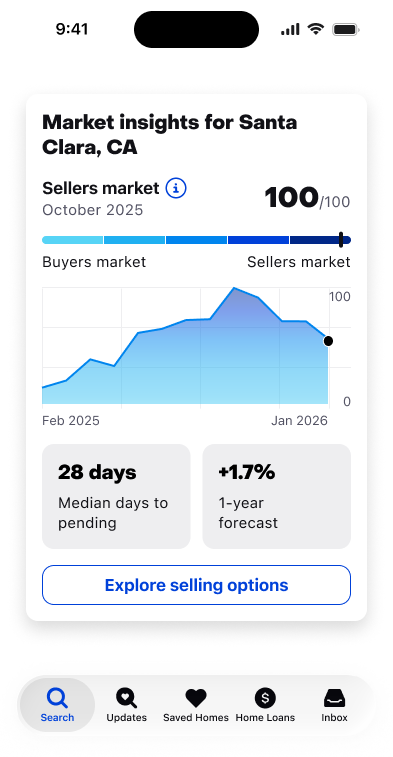
What it does Visualizes local market temperature (buyer vs. seller market) alongside historical trends and 1-year value forecasts.
What it solves Eliminates market uncertainty by replacing guesswork with localized, data-backed timing signals.
2
What it does Surfaces local days-to-pending metrics and inventory shifts in a single, scannable dashboard.
What it solves Helps sellers time their listing strategy to capitalize on peak buyer demand.
Tool 2

Demand Discovery V2

Result
+26.9% agent connections, iOS
Demand Discovery V2. Statistically significant lift in seller-to-agent conversions.
1
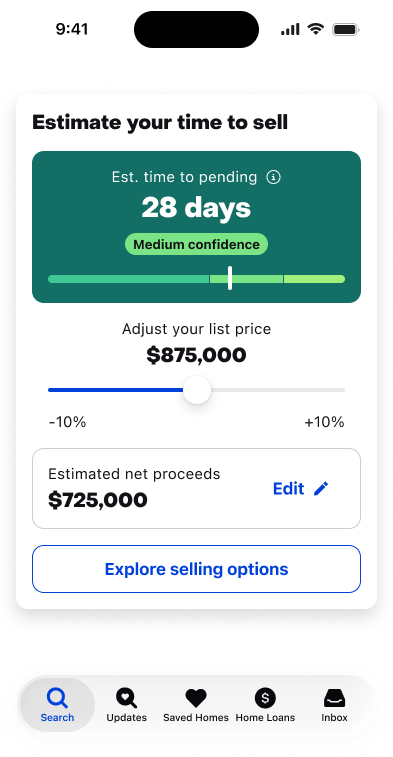
What it does Provides an interactive slider linking target listing price directly to estimated time-on-market.
What it solves Gives sellers control over trade-offs between maximizing price versus closing quickly.
2
What it does Dynamically models buyer interest and net proceeds based on real-time market comps.
What it solves Sets realistic expectations on walk-away cash before signing an agent agreement.
Design decisions
01 Segmented meter for confidence
Already established pattern in Market Insights V1, now a part of the design system. Cheap for engineering to build and the most compact of the options, satisfying the HDP team’s 570px max height design principle.
See rejected data visualizations
02 A single number, not a range Sellers want one number. I didn't want to add a range to a decision that already felt confusing. A concrete number instills more confidence, so I made sure we could model a realistic single number we could stand behind.
03 Teal green color palette Green signals trust in Zillow’s new visual identity, and the number of days to sell is exactly the figure we want sellers to trust. See rejected color palettes
How I got here

Why it looks like this

Both tools went through an earlier iteration built on the data available at the time. The goal was to test whether sellers would engage with a tool like this at all, then use that signal, plus better data, to answer the real questions: should I sell now or wait, and how long will it take?

The constraint we designed inside Every mobile module is capped at 570px tall These tools live on a page owned by another team, the Home Detail Page (HDP) design team. Their design principles cap any mobile module at 570px of vertical space, so every layout had to conform to that max height.
V1 Test the appetite Ship with the data we had and see whether sellers engage at all.
Signal Read the experiment A/B results show what moved, what stalled, and which numbers sellers used.
V2 Answer the real question Better demand data: should I sell now or wait, and how long will it take?
01
The constraint

V1 tested the water with existing data, to see if sellers would engage with such a tool

Initial problem statement · Demand Discovery Sellers lack visibility into how their list price directly impacts buyer demand and engagement, leaving them deeply uncertain about the eventual success and timeline of their home sale.
Market Insights V1 · iOS

We knew sellers wanted to understand the market, and these were the four data points our data could support. We did not know which one mattered most, so the plan was to A/B test and follow up with qualitative research.

Demand Discovery V1 · iOS

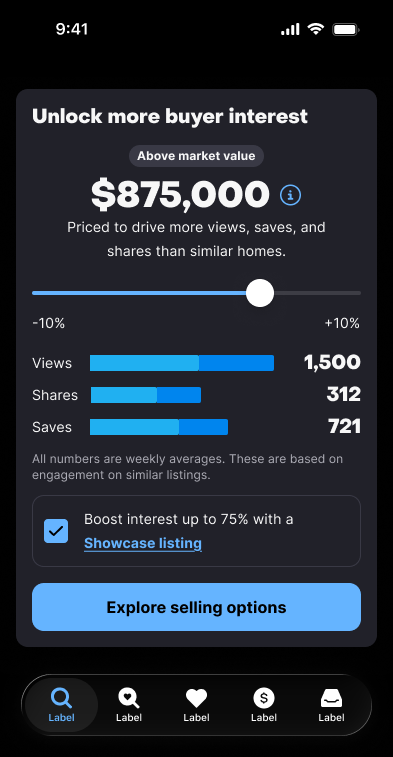
The only data available at the time was the engagement a seller could expect at a given list price, which is what the design models. Sellers could also see the boost in engagement they would get with the Showcase product.
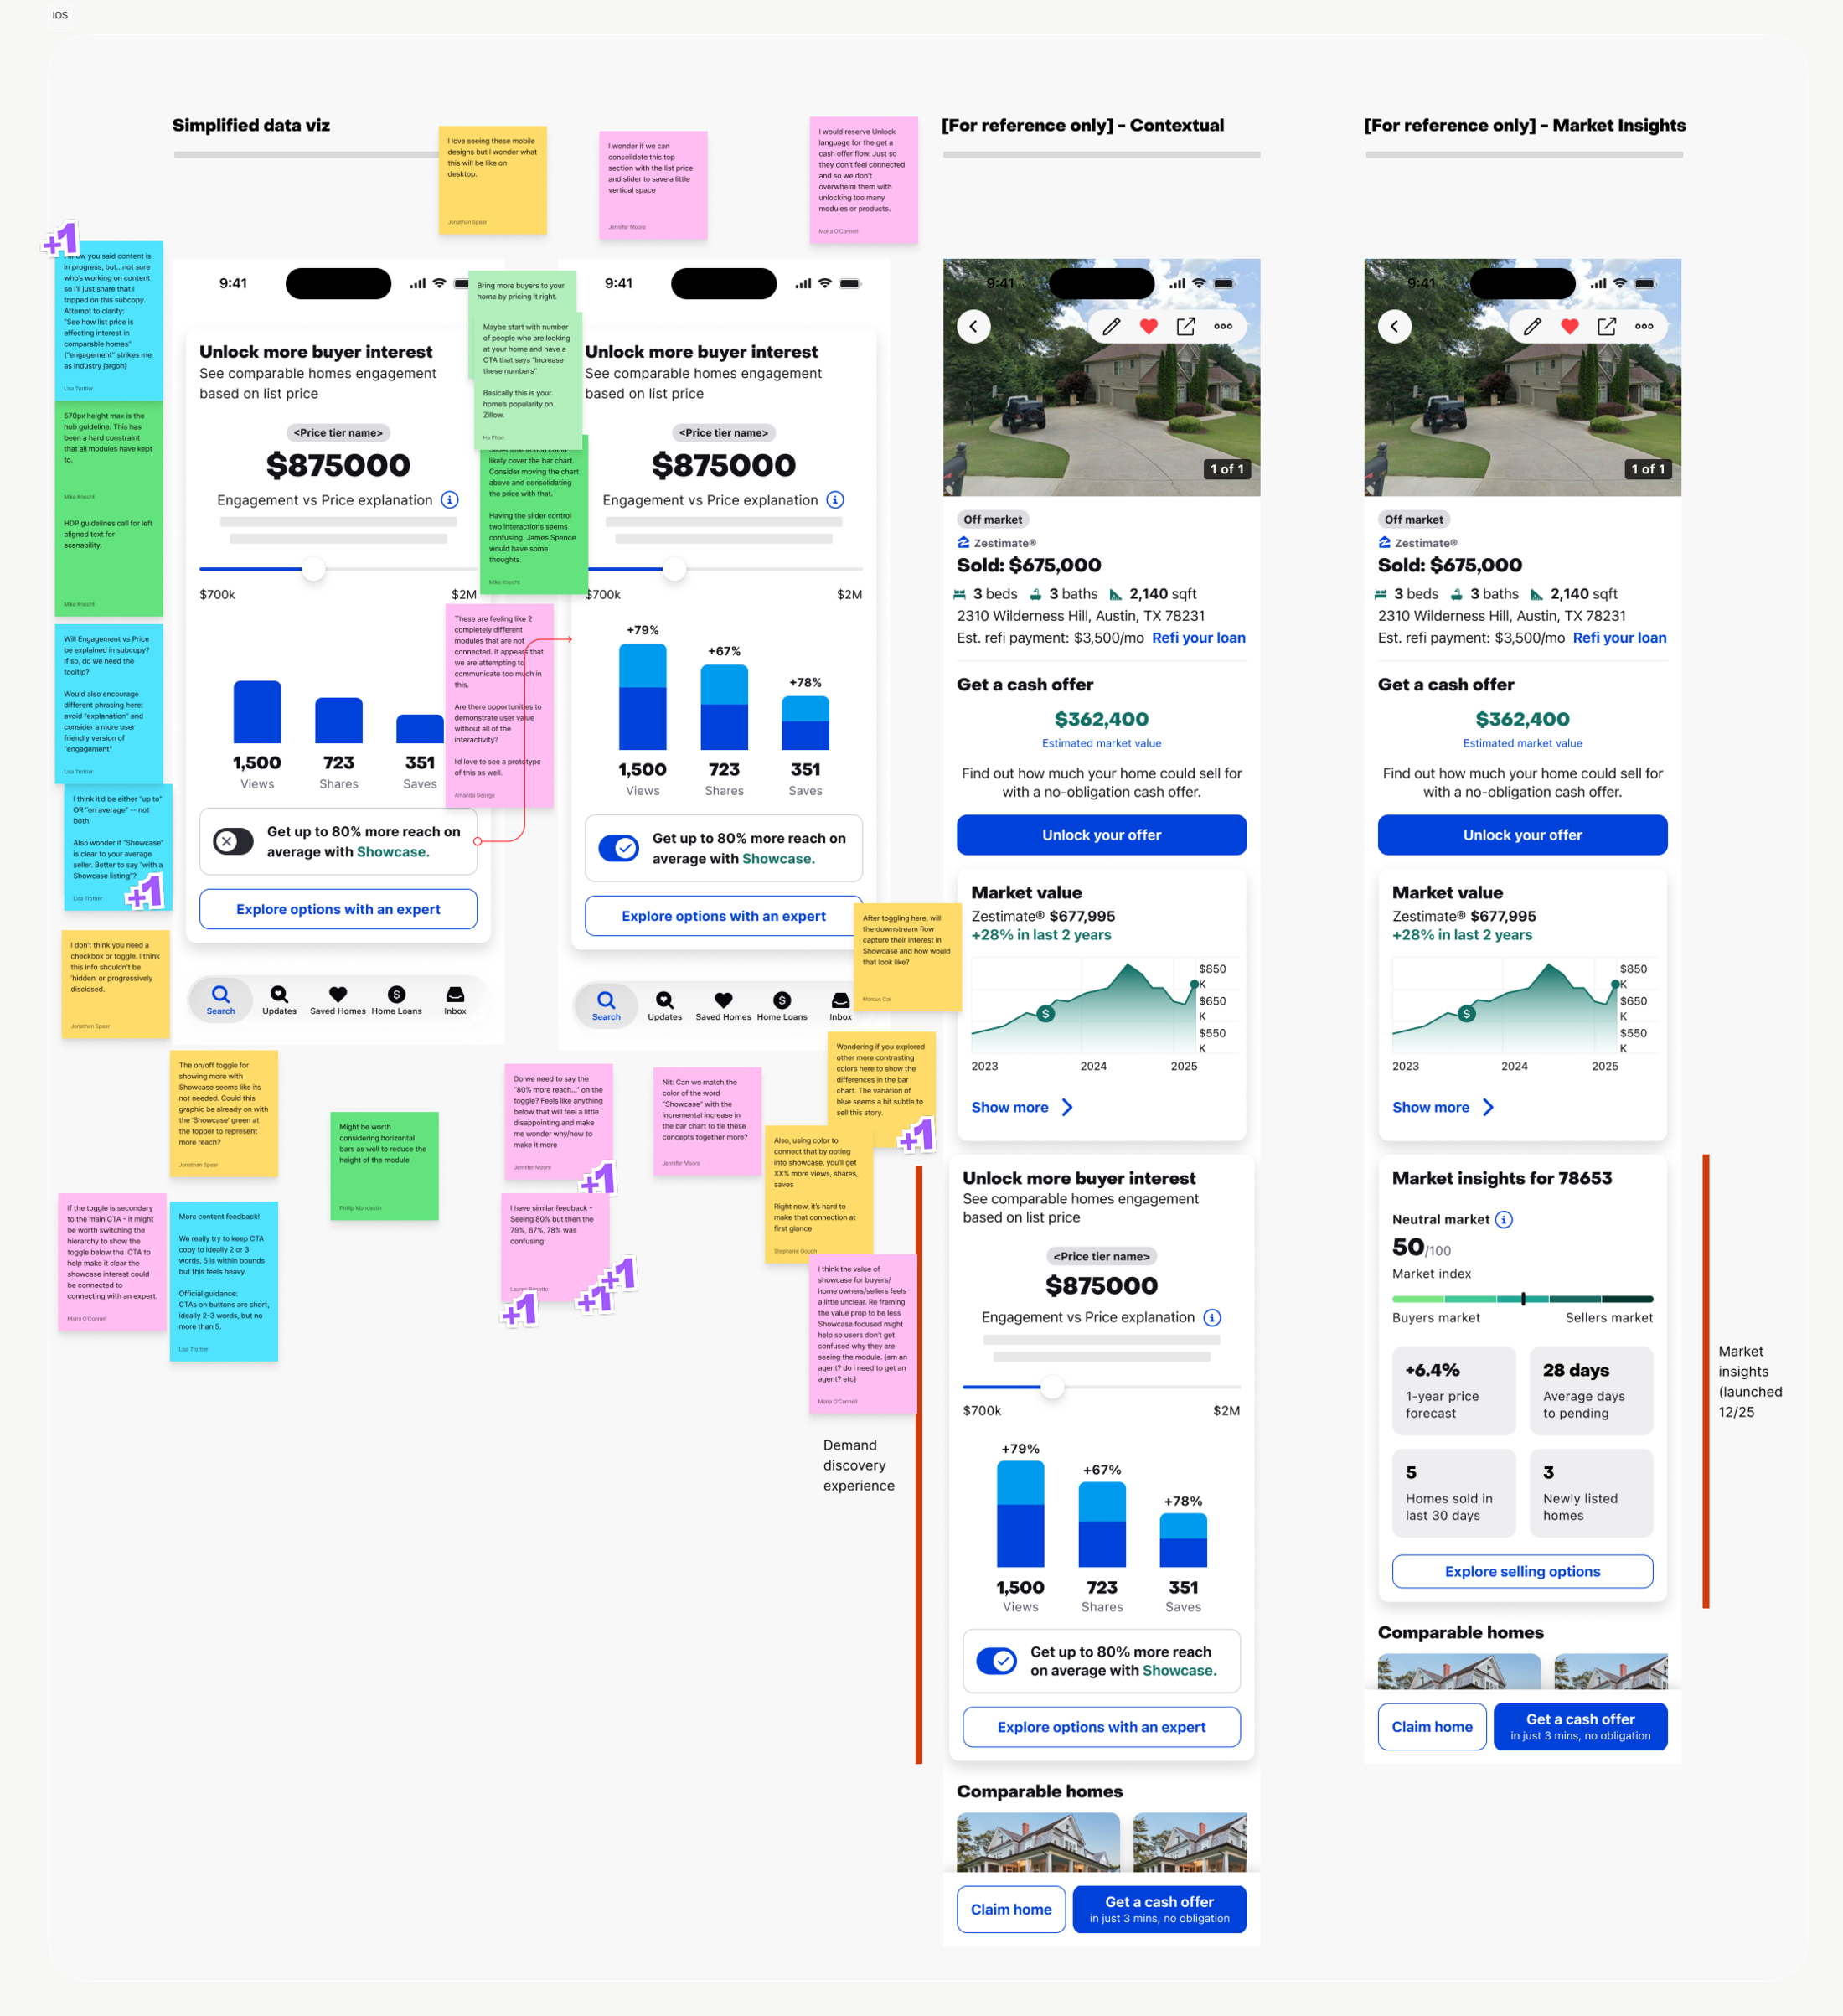
Internal design crit on a Demand Discovery V1 iteration Cross-functional crit with design, content, and product. Feedback covered data-viz simplification, the Showcase toggle, and the HDP team’s 570px height guideline.
Design decision · Demand Discovery V1 Horizontal bars to save vertical space and keep the layout stable as users move the slider. They also made the values easier to represent consistently.
Design crit board with team feedback on a Demand Discovery V1 iteration
02
What V1 taught us

We learned in production, not in a user study

This was measured on live traffic. V1 of Market Insights was successful. Demand Discovery, on the other hand, showed strong engagement but did not move the conversion needle.

A/B tests told us what moved and what didn’t, but they couldn’t tell us why, so V2 was a hypothesis about the why, tested the same way.

03
What changed

Better demand data meant we could finally answer the question properly

The upgraded data let us model, in real time, what a given list price would likely get a seller, and show how much confidence Zillow had in that number.

The constraint that shaped V1 had lifted. That reframed the question from how to present a coarse signal well to what this should be now that we could actually answer it.
04
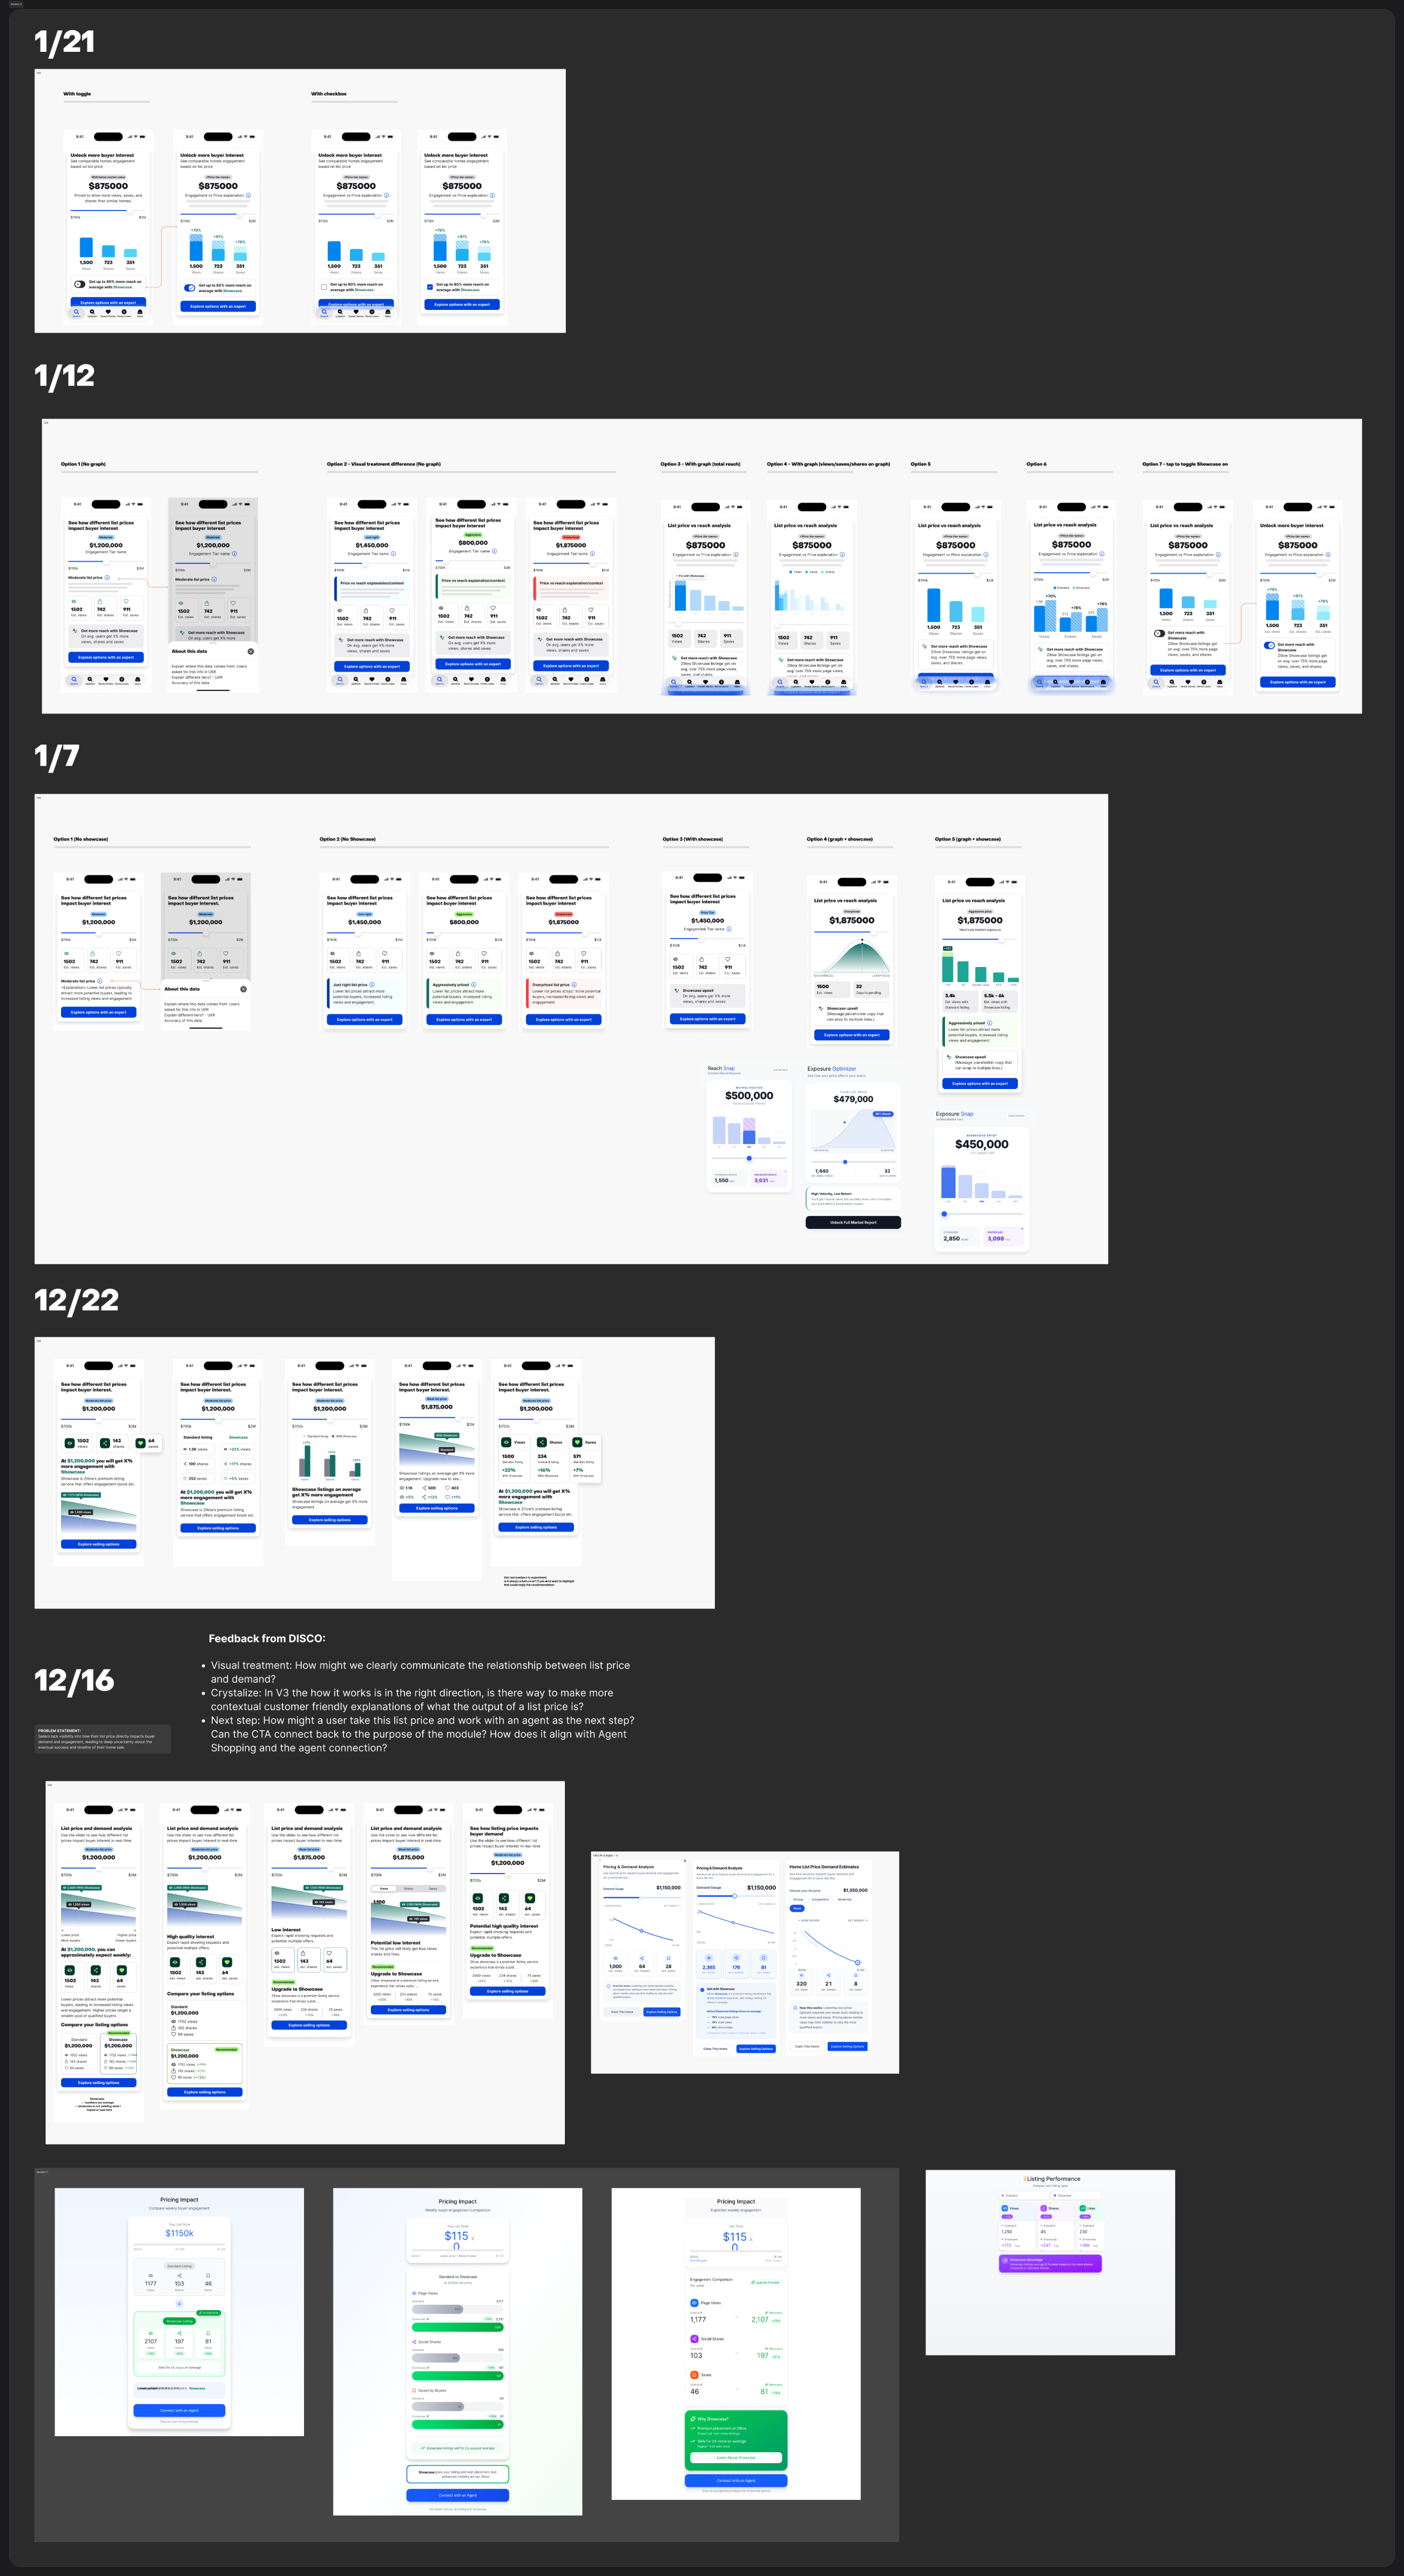
Exploration 4.1 · Demand Discovery V1 Everything I rejected for Demand Discovery V1Timestamped iterations in Figma, a combination of Figma Make and Replit.
Timestamped Figma history of Demand Discovery explorations
4.2 · Demand Discovery V2

Everything I rejected for Demand Discovery V2
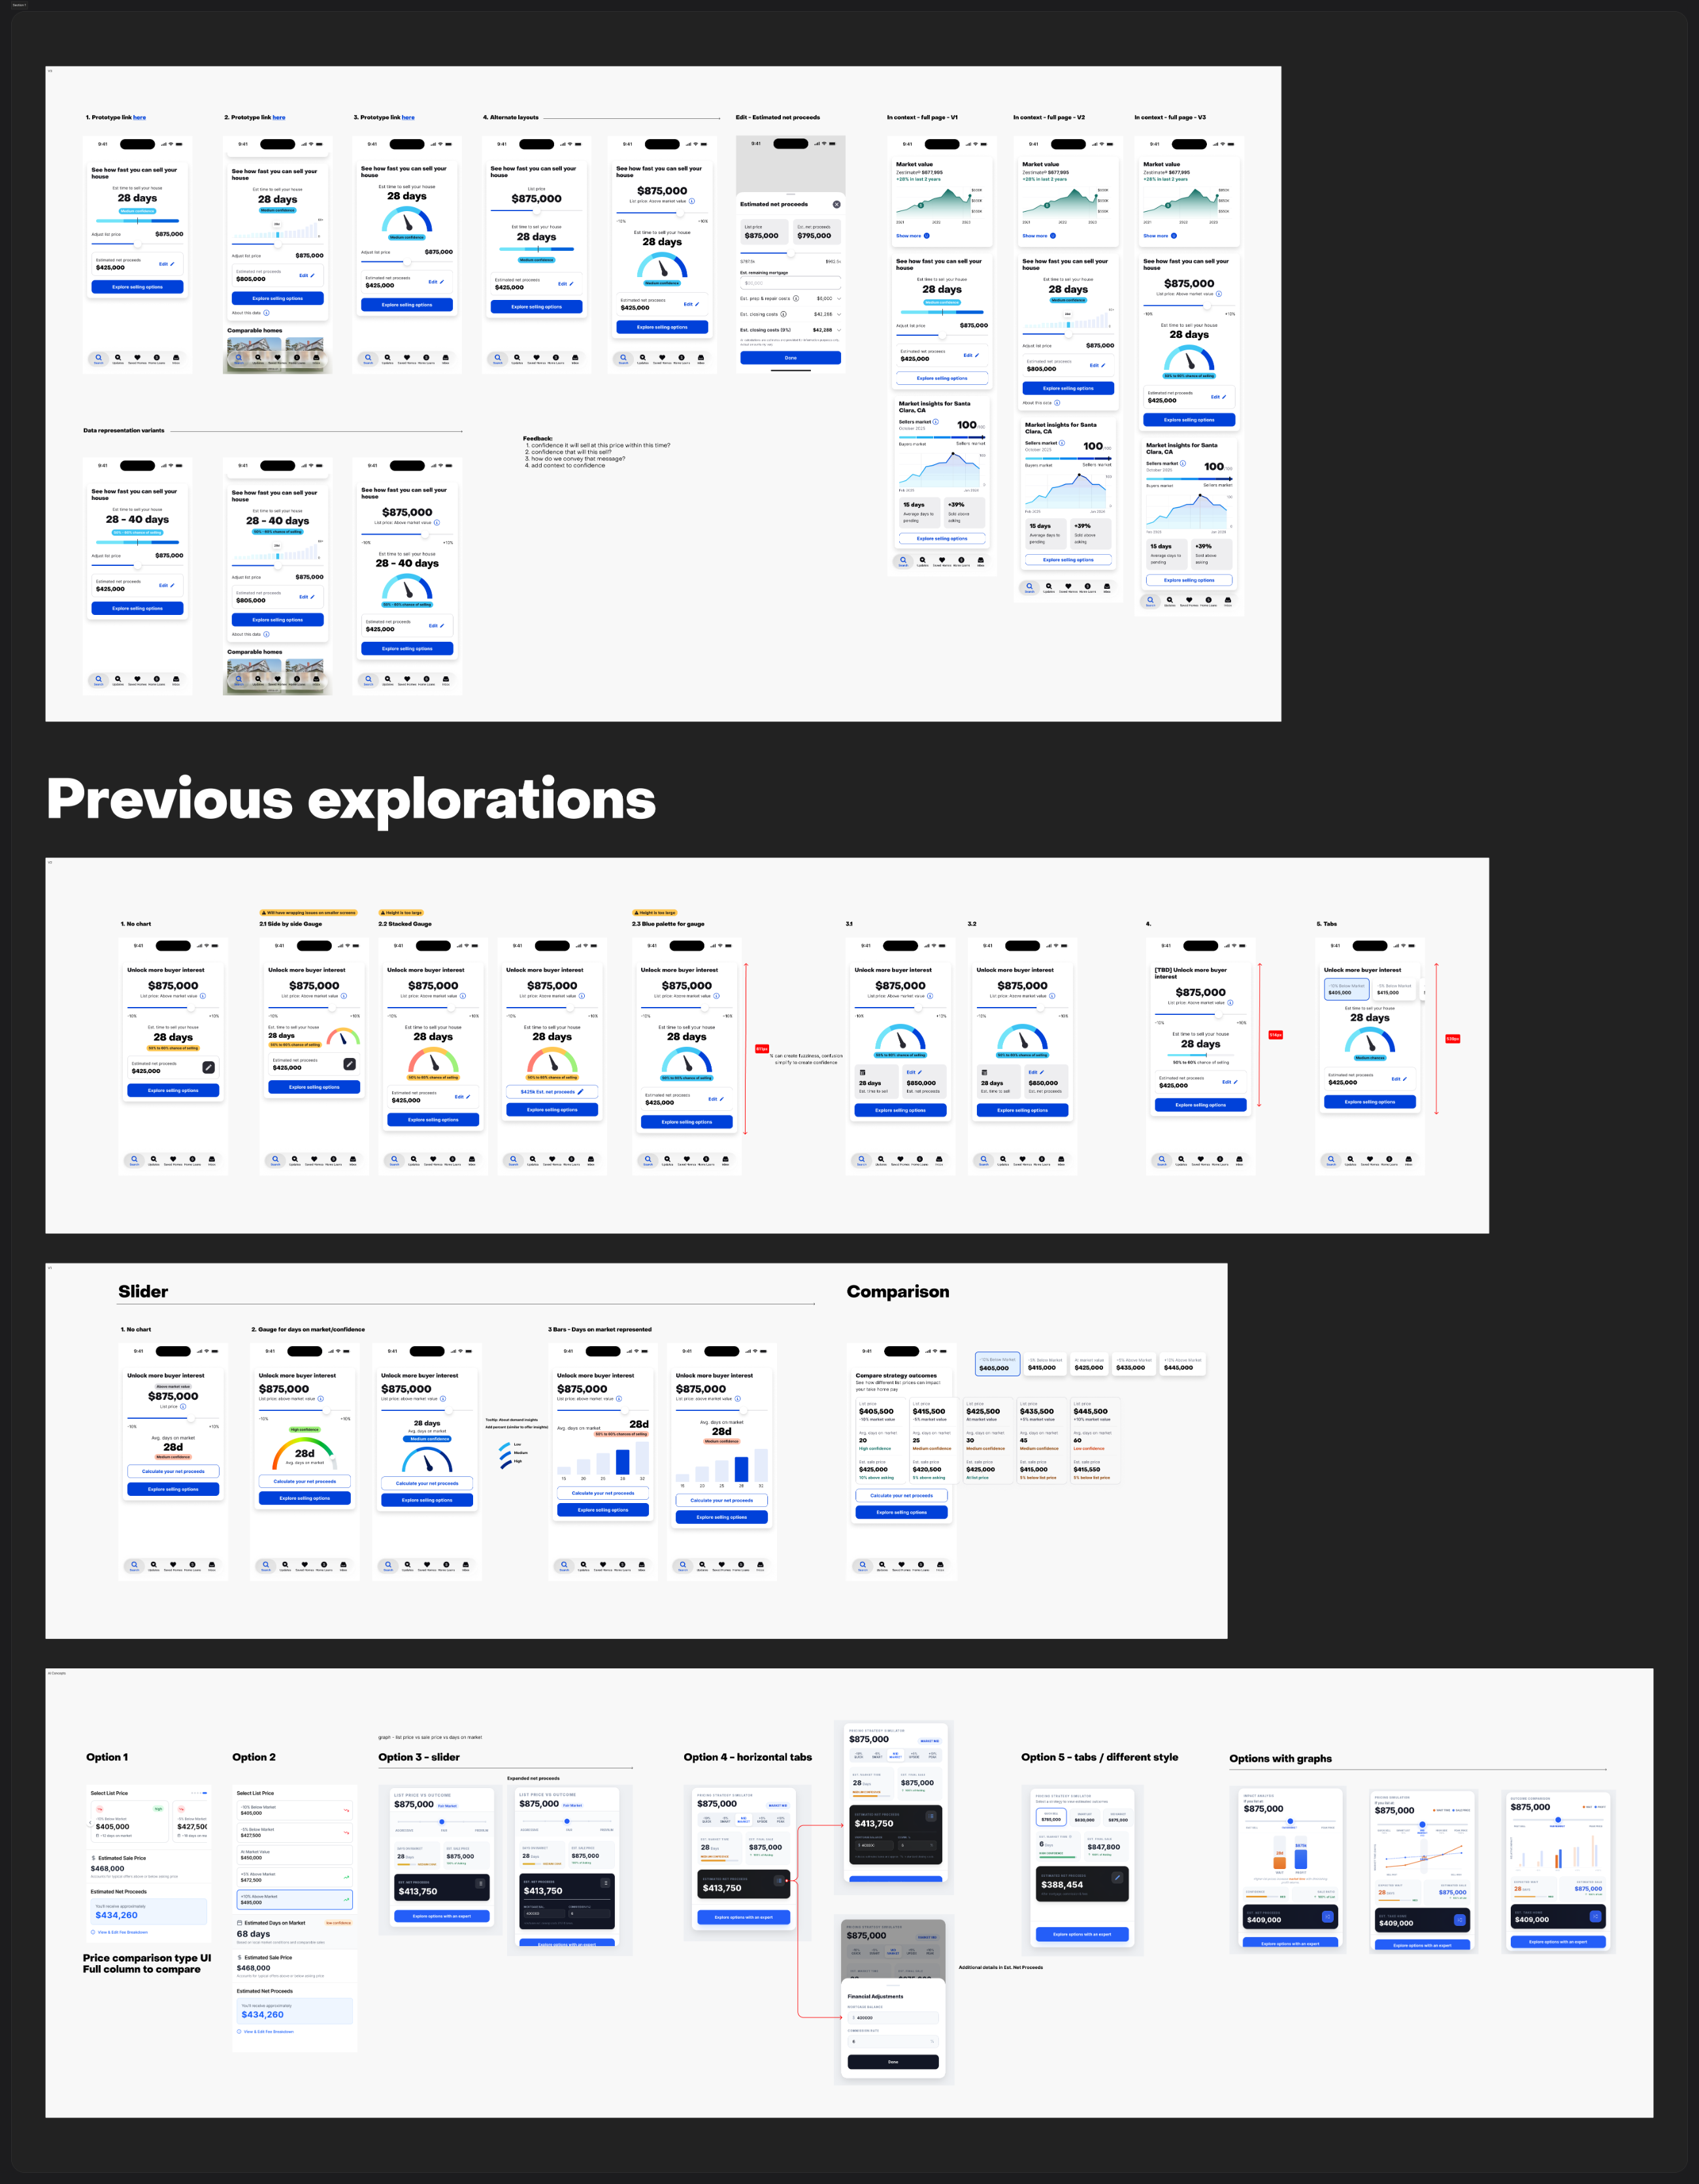
Demand Discovery V2 structural explorations
Five structural options generated with AI Color palette explorations for the final iteration
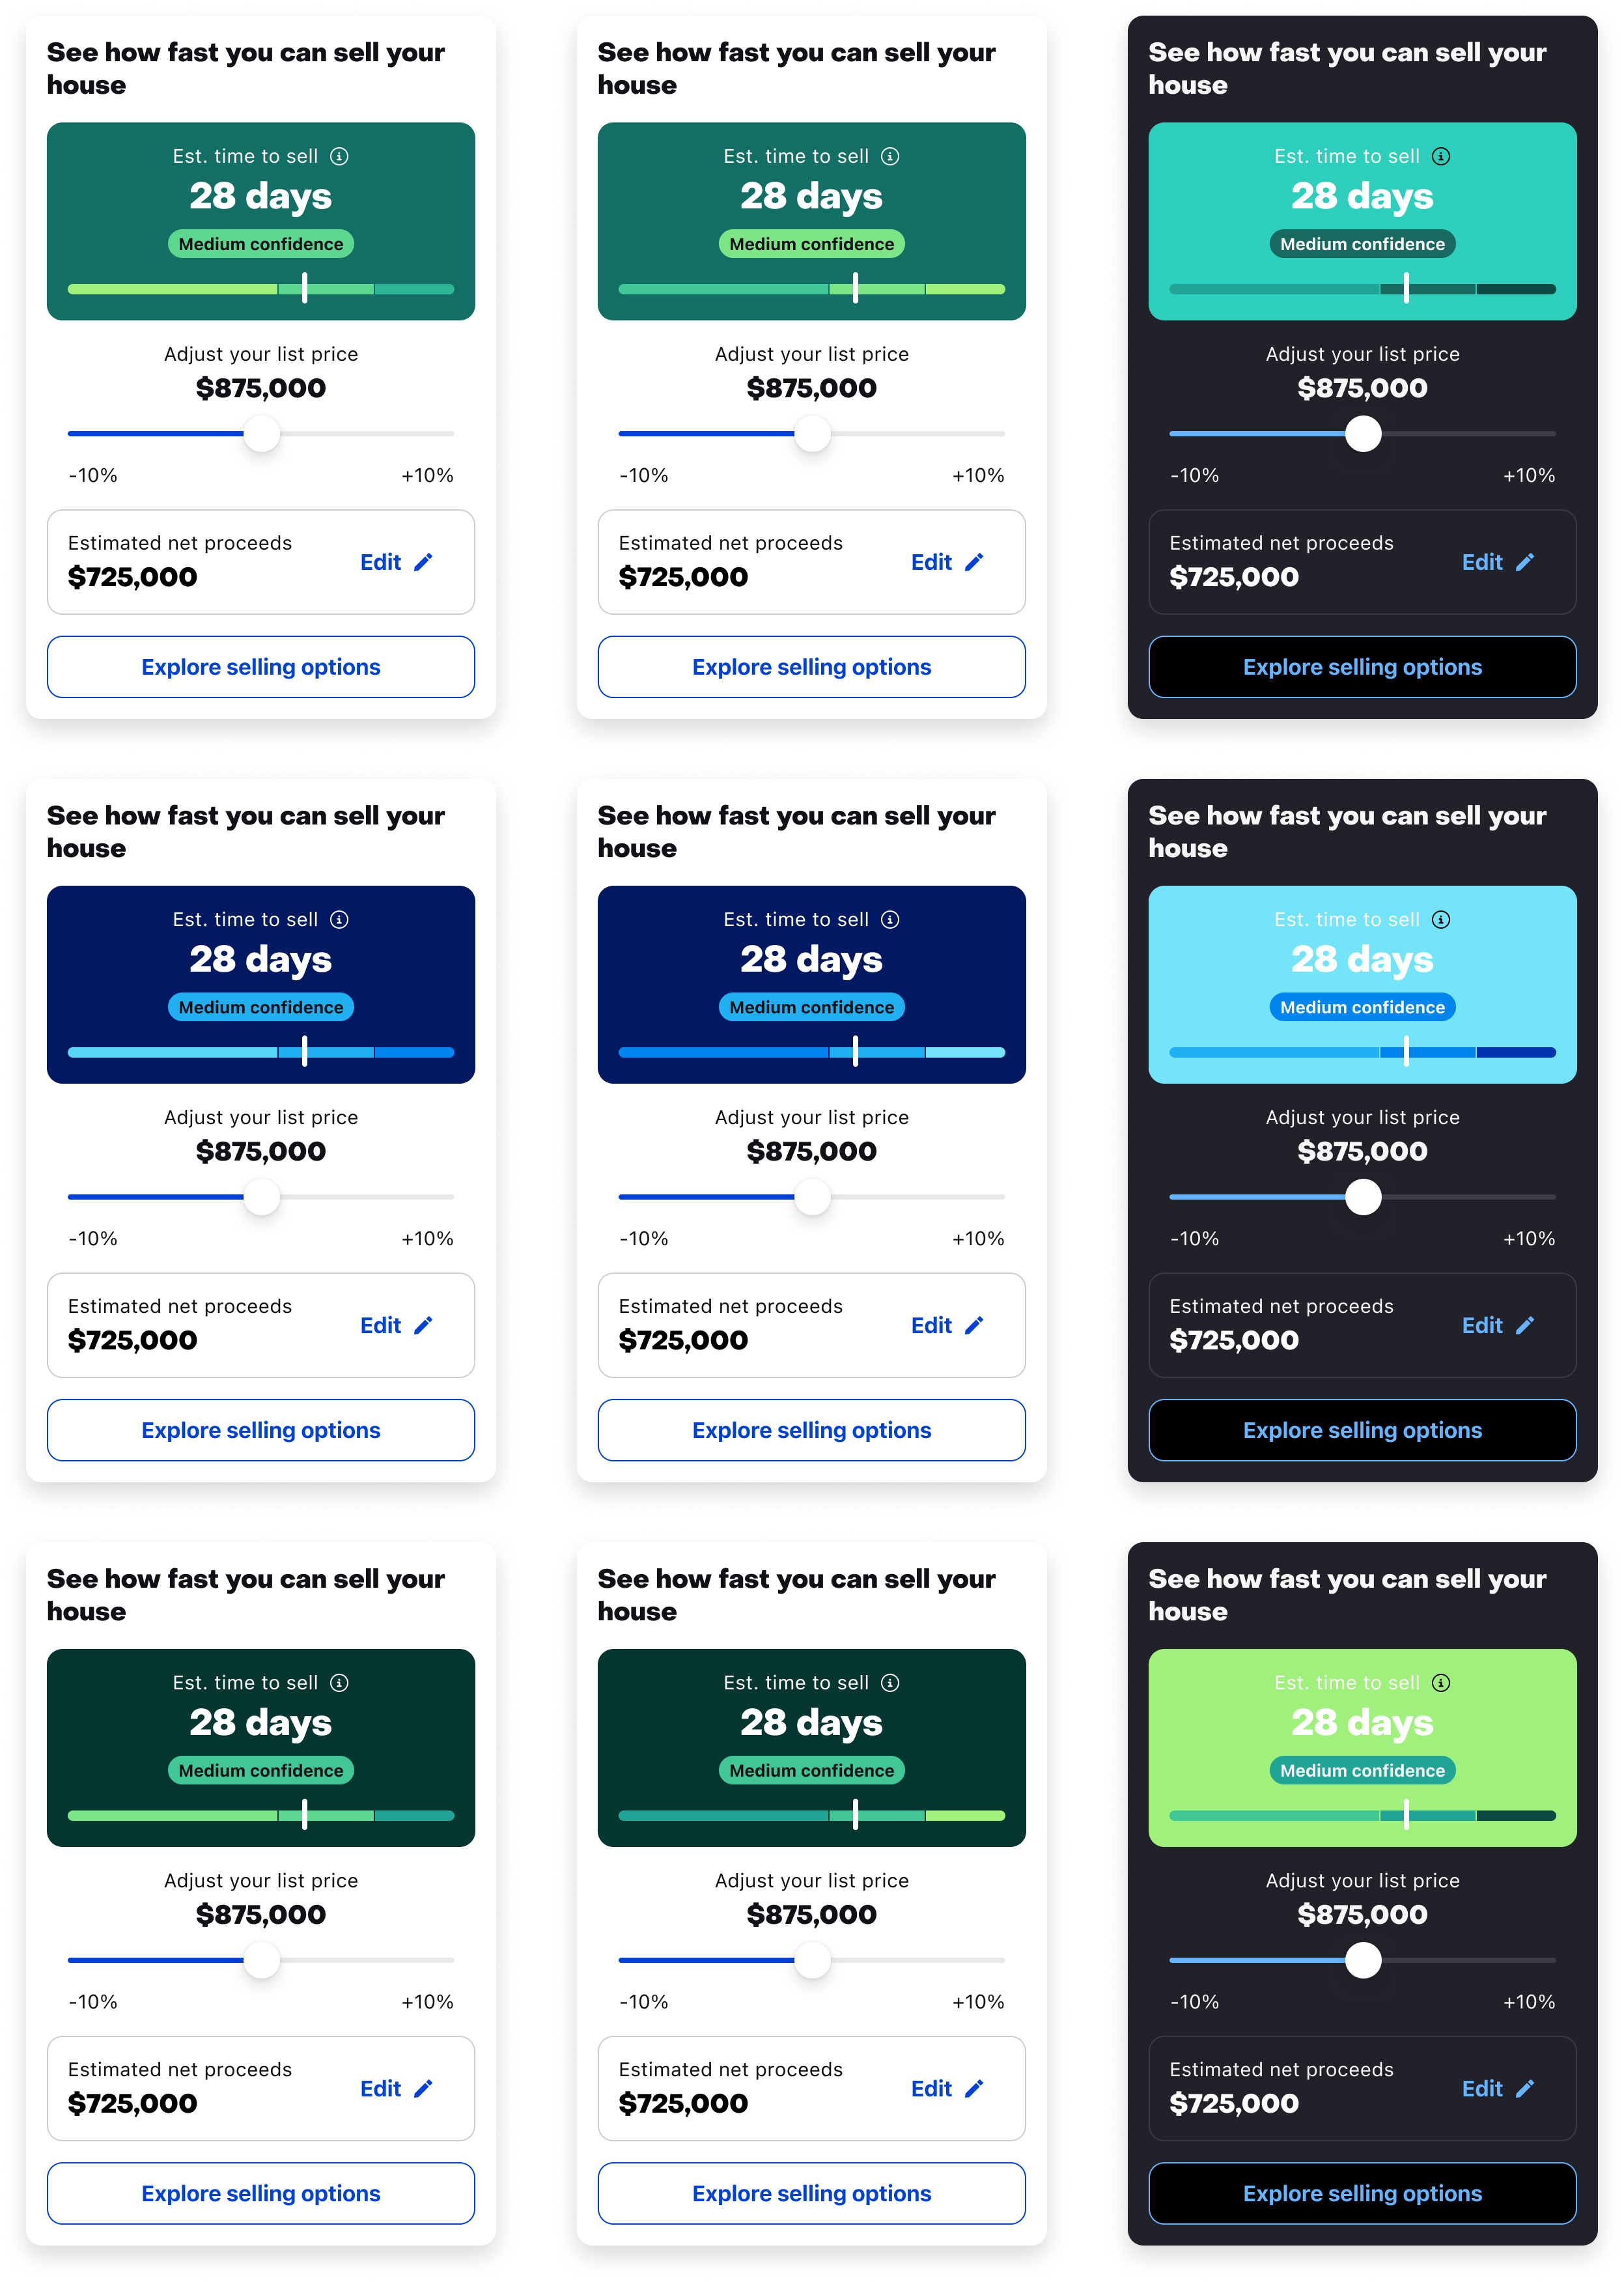
Color and mode studies on the shipped layout
Color, contrast, and confidence-chip hierarchy tested across light and dark to meet Zillow’s accessibility standards.
Gauge dial [TODO: verdict]
Distribution histogram [TODO: verdict]
Segmented confidence meter [TODO: verdict]
Price-first layout [TODO: verdict]
Day range vs. single number [TODO: verdict]
05
What shipped

V1 → V2

Iteration 1 Market Insights · Light mode
Iterated
Iteration 2: current Market Insights · Light mode
Iteration 1 Demand Discovery · Dark mode
Iterated
Iteration 2: current Demand Discovery · Light mode
Reflection

What I would do differently

I would unify both tools into a single connected flow from day one to understand how users used the two tools together rather than in isolation. Launching them sequentially created a handoff gap between evaluating market timing and modeling price scenarios, which required a subsequent sprint to bridge.

Next case study Mobile Search Experience Redesign →
Protected case study This work is under NDA. Enter the password from my résumé or email me for access.
That password didn't match.